Thwaites study puts hidden melt zones in focus: what the 30 mm projection actually means
A NASA update highlights a model calibrated against decades of satellite observations. Its upper projection concerns Thwaites alone under constant climate forcing, with important limits.
In this article
Key points
- NASA highlighted the research on 20 October; the paper was published in Nature Communications on 12 October 2026.
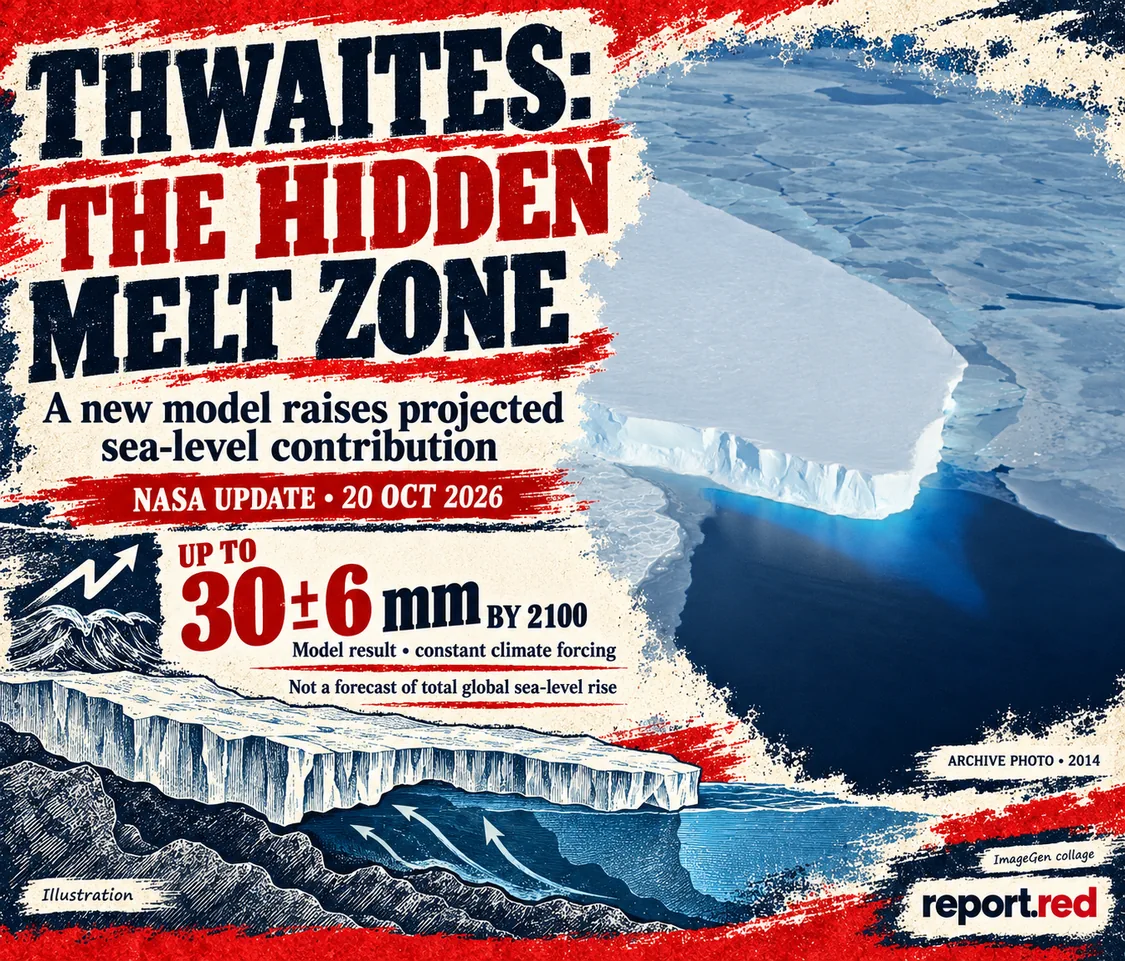
- A grounding-zone configuration consistent with recent observations projects about 30 ± 6 mm from Thwaites by 2100 under constant climate forcing.
- This is a model result for one glacier, not a prediction of total global sea-level rise or a fixed collapse date.
A study highlighted by NASA on 20 October offers a more detailed explanation for why Antarctica’s Thwaites Glacier could add more to sea level this century than some earlier estimates. The change is in how the model represents seawater reaching underneath ice that is still grounded on the seabed. For coastal readers, the useful distinction is between a better description of a physical process and a guaranteed timetable for future flooding. [1]
A broad melt zone replaces a sharp boundary
Many ice-sheet models represent the transition from grounded to floating ice as a line. The new work treats it as a zone in which seawater can penetrate beneath grounded ice and lift it during tidal cycles. Warm water can therefore melt ice farther inland than a sharp boundary would capture.
The paper, published on 12 October in Nature Communications, incorporates these actively melting zones into the Ice-sheet and Sea-level System Model. The authors calibrated the model against observations of retreat, thinning and acceleration from 1996 to 2023. Grounding zones several kilometres wide improved the reconstruction of that history. That agreement is evidence in favour of including the process; it does not make every future simulation certain. [2]
Read the number with its scenario attached
For a grounding-zone length of 5 ± 1 kilometres, consistent with recent high-resolution observations, the paper reports a projected contribution of 30.1 ± 5.7 millimetres by 2100. Rounded, that is about 30 ± 6 millimetres, or roughly 3 centimetres. The experiments hold climate forcing constant at a historical baseline. The number describes Thwaites’ contribution to global mean sea level in that model configuration, rather than the combined rise from all glaciers, ice sheets and ocean warming.
A different configuration, with a 3 ± 1 kilometre grounding zone, produces 19.4 ± 5.2 millimetres. This difference matters: the study is identifying sensitivity to an uncertain physical feature, not announcing a single inevitable outcome. The authors compare the higher result with an earlier model-ensemble mean, whose own uncertainty is wide; “doubling” should not be read as every previous projection being uniformly too low.
What the research can and cannot guide
The model uses a fixed grounding-zone length even though real intrusion distances can change with tides, water pressure and the shape of the bed. It also leaves out some ocean and geometry feedbacks in the evolving cavity beneath the ice. The paper discusses uncertainty in seabed topography as another obstacle to reconstructing retreat accurately.
For coastal planning, the contribution is a clearer reason to examine how ice-sheet processes enter long-term scenarios. It does not supply a flood forecast for a particular city, a local sea-level allowance or a date on which Thwaites will collapse. Those questions require additional regional evidence and scenarios. This report is based on the opened research paper and NASA’s institutional explanation, not a field visit to Antarctica.
Explore more science reporting
Archive photograph associated with NASA’s 2014 Thwaites coverage, showing the glacier in West Antarctica. It is not an image of a newly observed 2026 collapse. Adapted into an ImageGen editorial collage; NASA supplied the source photograph and did not review or endorse this collage. NASA is not responsible for the accuracy of the generated artwork. NASA · Public domain. ImageGen / report.red.